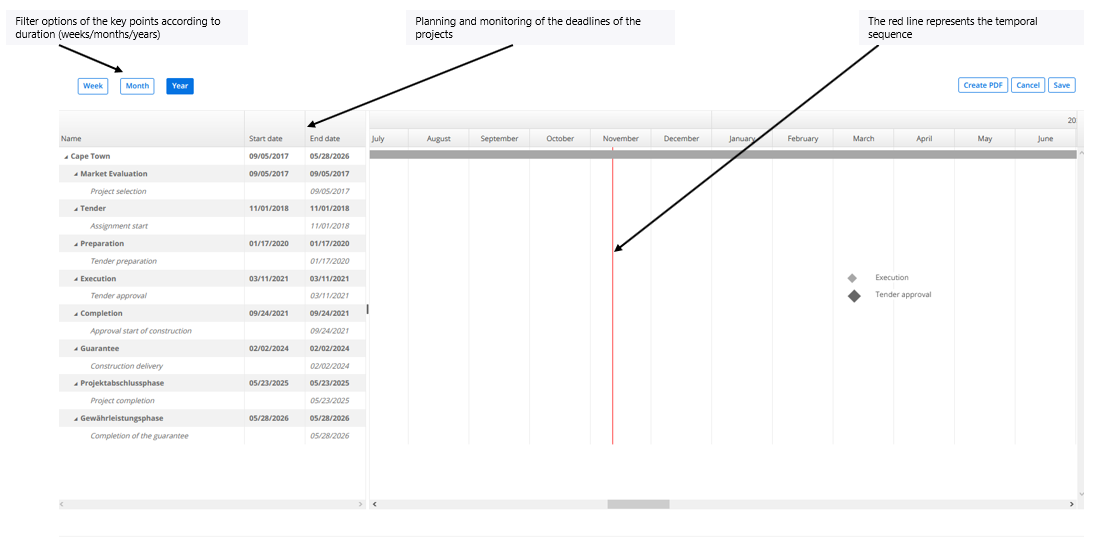
The Gantt chart provides an overview of the progress and duration of a vertex in the form of a bar chart
The aim of the Gantt chart is to further visualize the dates, degree of completion and dependencies of the project's points, milestones and phases. With drag and drop, you can move appointments (start and target) and determine the degree of completion. Dependencies indicate which project vertices must be executed beforehand until the next project vertice can be executed (arrows).
Functions:
- Overview of all cornerstones of the project with the respective progress and the scheduled start and end dates
- Filter option for daily view
- Presentation of the print view as PDF